
Everymundo created the airTRFX Performance Dashboard to help our customers track the user engagement with their airTRFX Pages, from the first pageview to the final bookings and revenue. Learn how to manage parameters with dashboard actions in tableau!
When Customers open the report, they gain quick insights into the overall performance of airTRFX Pages, with the ability to view the performance by device and site edition. The airTRFX Dashboard has features that give users control over measures to show in a line graph or a view by using Parameters: https://help.tableau.com/current/pro/desktop/en-us/parameters_swap.htm
But, how can we hide the parameters when we don’t need them? For example, in the video below, we only need a clean overview when we open the report and do not want the parameters for Line Graphs to show up (ex. Primary KPI, Secondary KPI and Comparison Mode). After getting a big picture of the overall performance, if we want to see the performance trend over time by a specific Page Type or the detailed sub-category performance, then we need the graphs, tables and parameters.
General Steps
- Create the main table.

2. Create a target graph we want to show when selecting a specific field in the main table. This graph should include the parameters (ex. Primary KPI and Secondary KPI) and the calculated fields responding to the parameters (ex. Primary KPI and Secondary KPI in green pills).

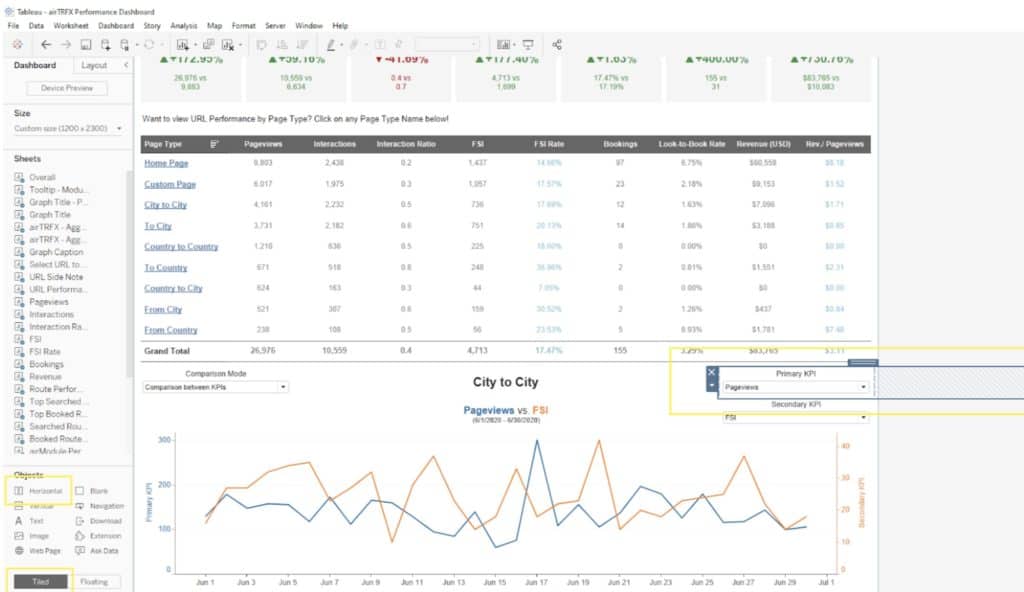
3. Create an “spacer” worksheet to help hide the parameter in the dashboard. This worksheet should have a blank calculated field (ex. Parameter Floating Hiding Column) to serve as a linkage in the dashboard action later.
![]()
4. Create a new dashboard. Put the main table and the target graph into the dashboard.

5. Add a Horizontal Tiled Container to where you want the parameter to show up. Put the “spacer” worksheet created in step 3 and the parameter (ex. Primary KPI) into the container.
6. Set up the dashboard actions. We need two separate filters to make the hide & show actions happen. One is using the main table to control the parameters and another one is using the main table to control the line graph.

The detailed set up for the filters are as follows.
For each filter, you need to have a source sheet (ex. Overall – Main table), a target sheet (ex. Line graph) and a linkage (ex. Page Type).
The expected result for the “Clearing the selection will:” part is different for these two filters.
Click OK to close the Edit Filter Action dialog box.

7. The configuration is now complete. Please return to the dashboard and try clicking on any Page Type value in the main table.
8. To achieve a complete dashboard like the one shown in the video, please repeat the configuration steps for the other parameters such as Secondary KPI and Comparison Mode in this dashboard.
About the dashboard
I am a data analyst at Everymundo and this airTRFX Performance Dashboard was created to help our customers track the user engagement with their airTRFX Pages from the first pageview to the final booking. When Customers open the report, they gain quick insights into the overall performance of airTRFX Pages. By digging deeper into the report, customers can see the performance on airModule, URL and Route-level. The data has been modified in this dashboard to maintain anonymity, please email [email protected] to access your dashboard.