AI powered, efficiency-improving bidding strategies for paid search advertisements.
Every route and property are considered a unique product.
Historic data factoring seasonality to make bidding decisions.
Creates clusters of data by market, route, property, and device into different bid classifiers.
Web search data and ticket price changes via FareNet are also considered to make decisions.
Real-time and automated adjustments using Google API.
airWire Search®
API of dynamic fares placed in search and dynamic retargeting ad copy.
Include dynamic fares in search and retargeting ads for every route or property.
Automated set up for dynamic business feeds via Google Ads API.
Multi-channel integration with Google Search Ads, Bing Search Ads and dynamic retargeting.
Relevant with airTRFX landing pages and airModules logics.
Multi-currency formats, supported by market.
Improved conversion rates and revenue per impression.
routeOptimizer®
Airline-specific automated portfolio bidding.
Advertise routes based on web sales and paid search performance.
Strategic route decisions based on conversion analysis.
Optimize budget and visibility of routes.
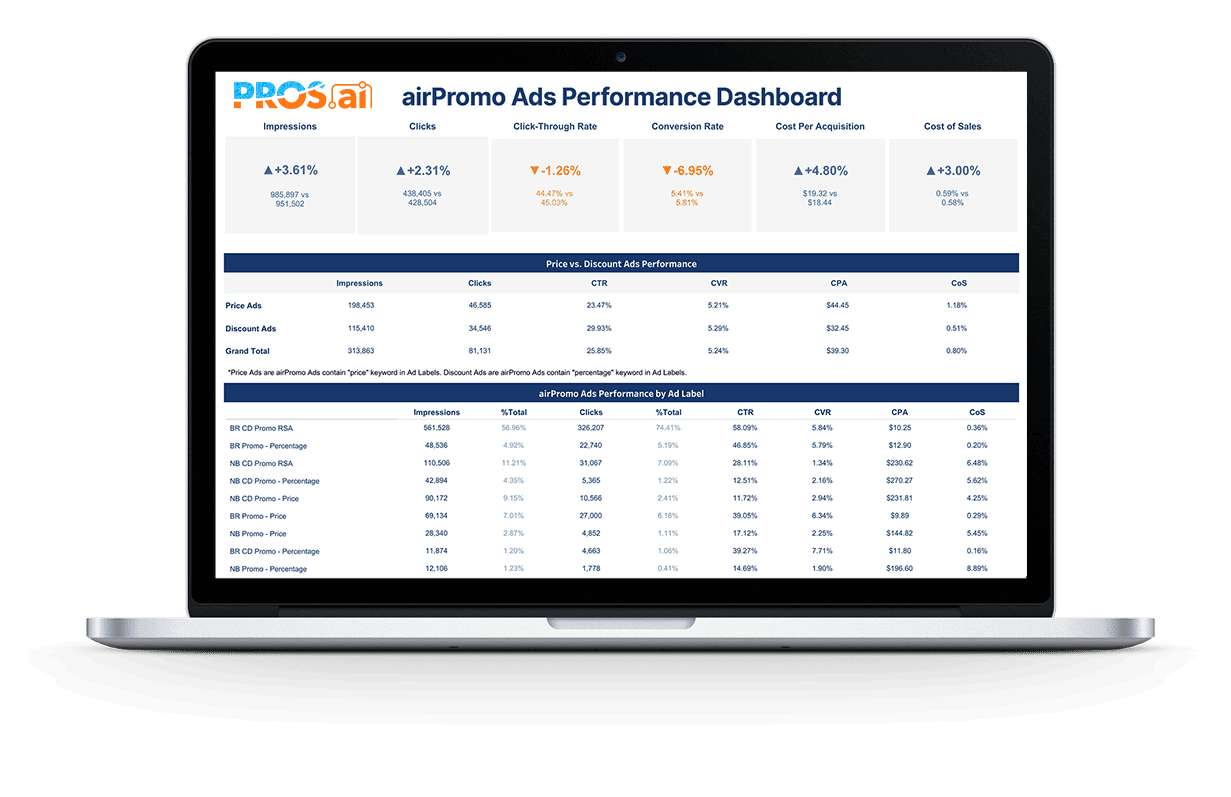
airPromoTM
Easily build, save, and schedule an unlimited number of promotions.
Automation of business feed set up withroute specific promotion details through Google Ads API.
Customization of promotional ad copy by filling in ad customizers with business feed data.
Flexibility for fare-based or percentage-based promotions.
Scheduling of unlimited number of promotions across markets and languages.
airBLDR®
Automatic targeted SEM campaigns tailored for every market and language.
Automated creation of new campaigns
Scalable SEM management of Ads and Keyword libraries.
Disciplined campaign structure that follows naming convention best practices.
Segmented creation of Non-Brand campaigns for all routes and destinations
Multilingual support in 30+ languages.
Global dictionary of geographic locations including airport codes, cities, and countries, including synonyms and variations.
Updated keyword library of best performing keyword patterns.
Get visibility on SEM performance with real-time dashboards
Automated daily updates and accessible at any time via Tableau.
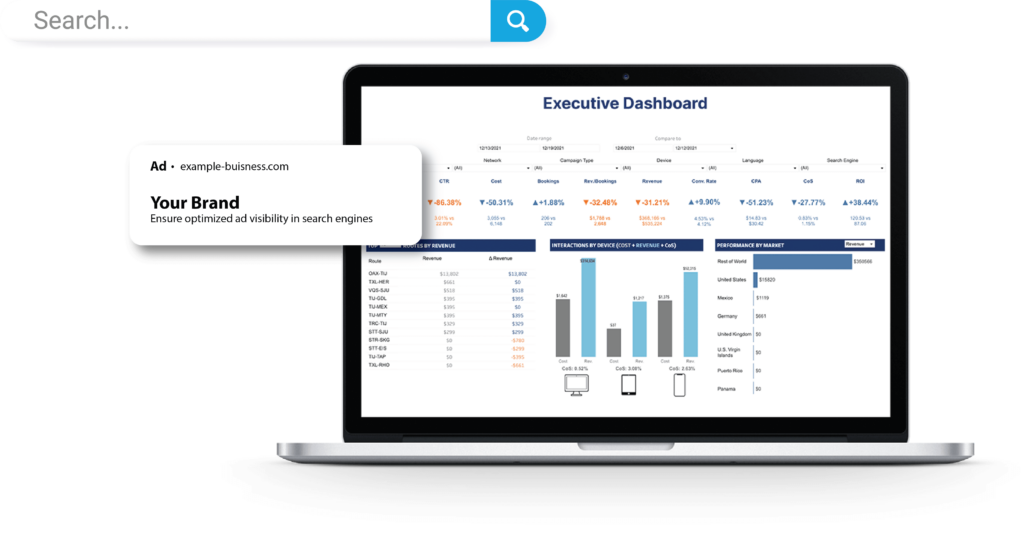
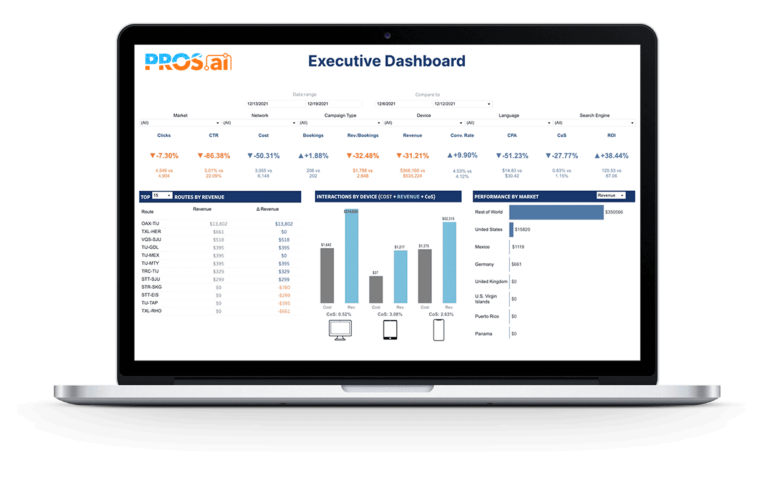
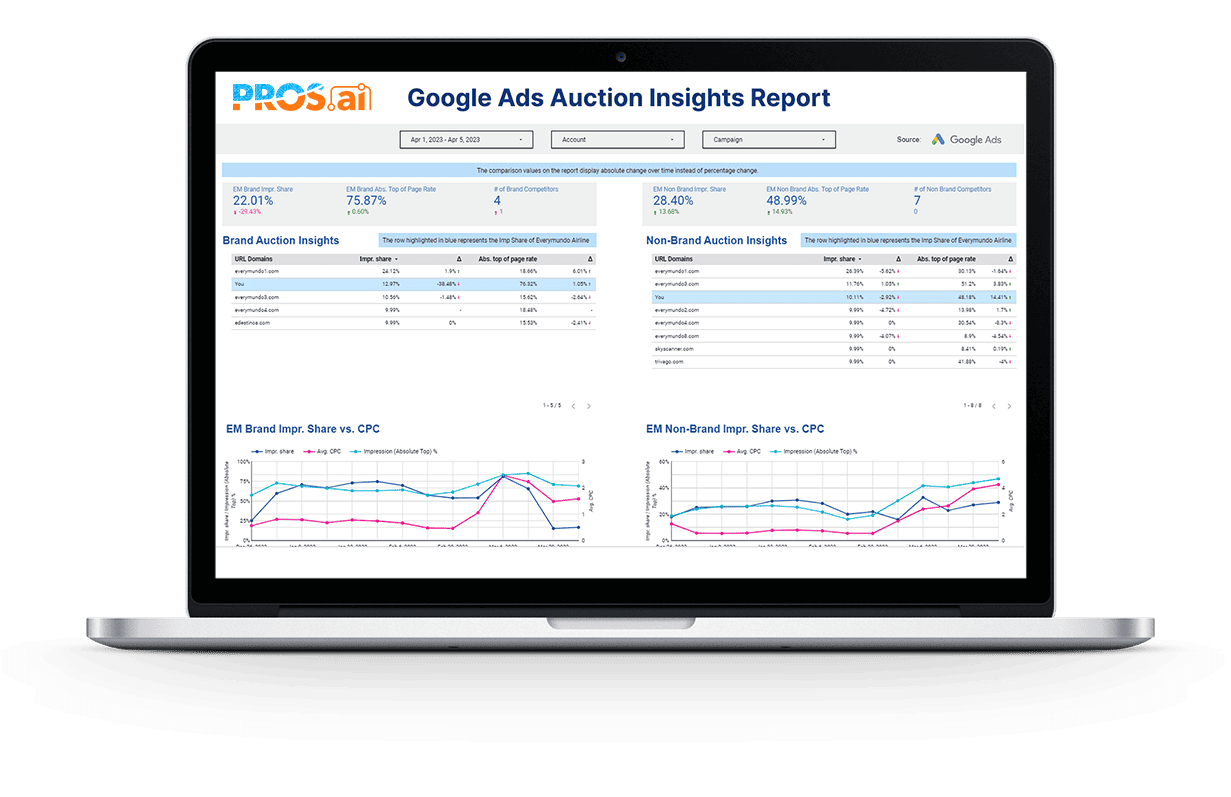
All-in-one dashboard that summarizes paid search performance
The airSEM Report contains various tabs that facilitate the monitoring of KPIs in different time periods. Users can identify trends by looking at the performance on specific dates or by day, week, month, or year. Additional insights can be gathered by exploring KPI behaviors by market, campaign type, route, device, search engine, and language.
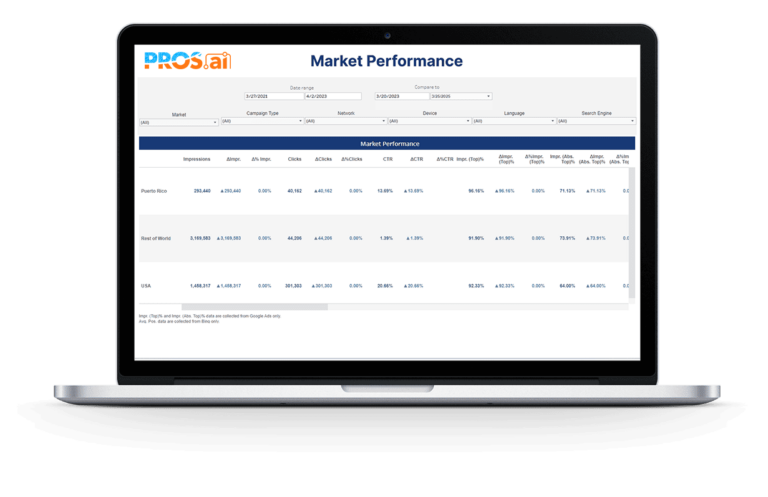
This dashboard compares your impression share with that of other advertisers who are bidding on the same keywords and, therefore, participating in the same auctions. By tracking the competition by campaign type and market, you can make strategic decisions about bidding and budgeting.
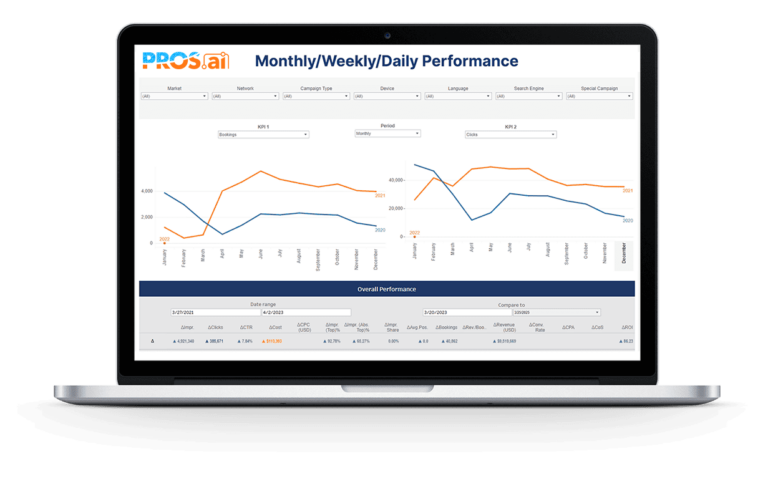
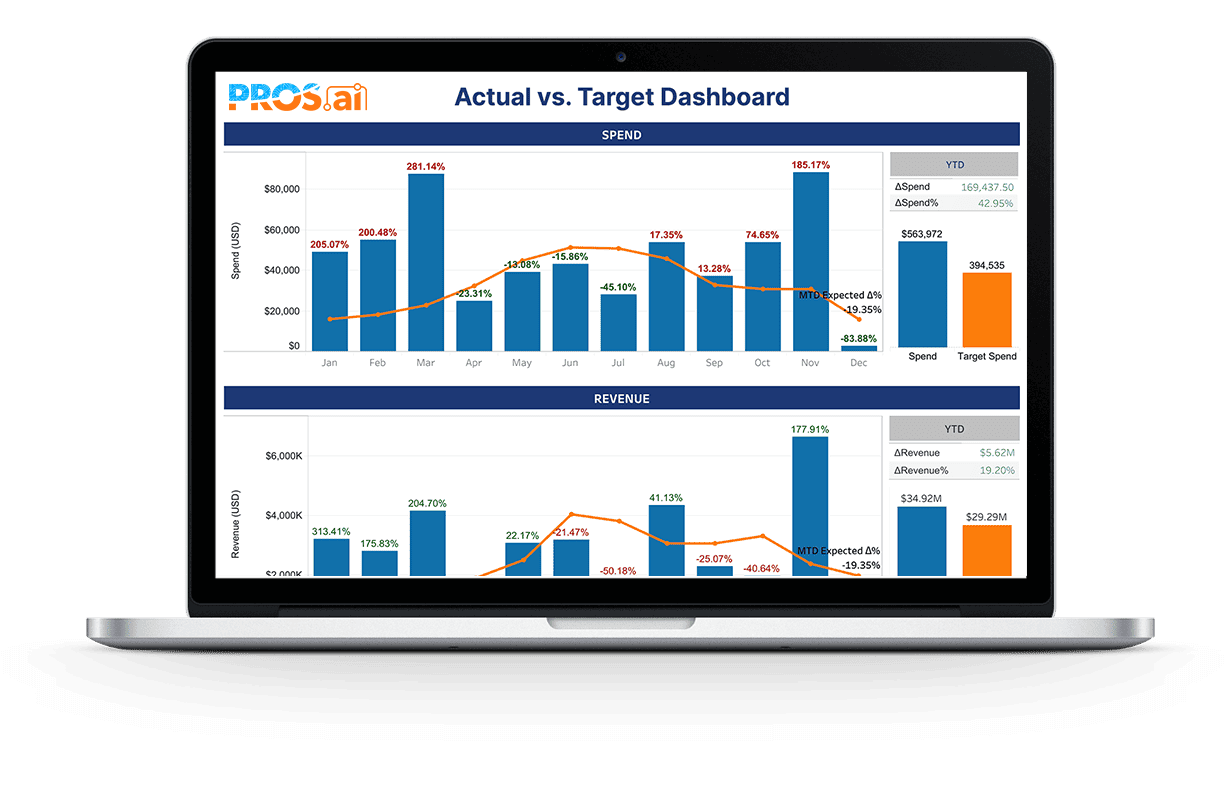
Track paid search performance alongside your KPI targets
The comparison of the actual versus target performance informs the optimizations on paid search activity throughout the month. Depending on how far below or above the target are versus the actual KPIs, you can take immediate actions to adhere to the monthly investment targets and maximize performance.
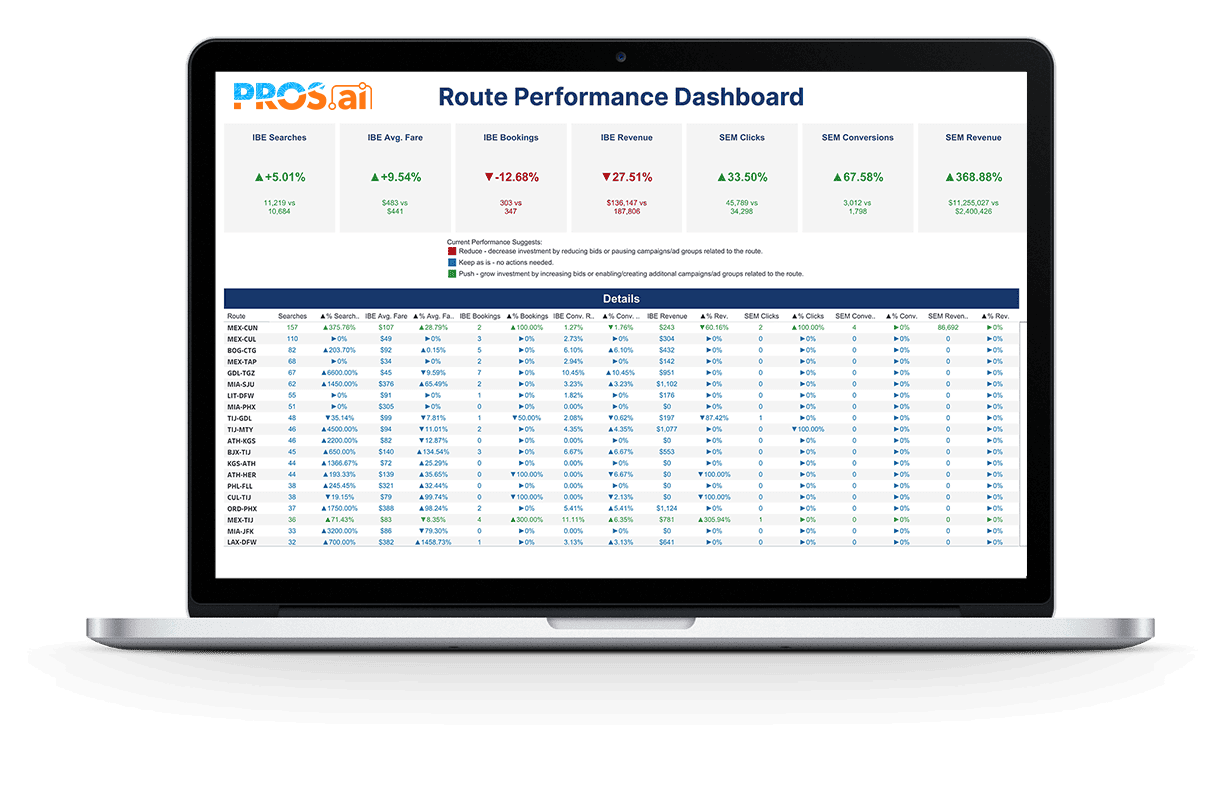
Centralized real-time performance based on search behavior
This dashboard facilitates route-based data-driven decision-making by combining data from the airline’s IBE and paid search. Routes that need attention are automatically highlighted, enabling you to know which routes to push, reduce, or keep. Routes can be segmented by origin, destination, flight type, market, and language.
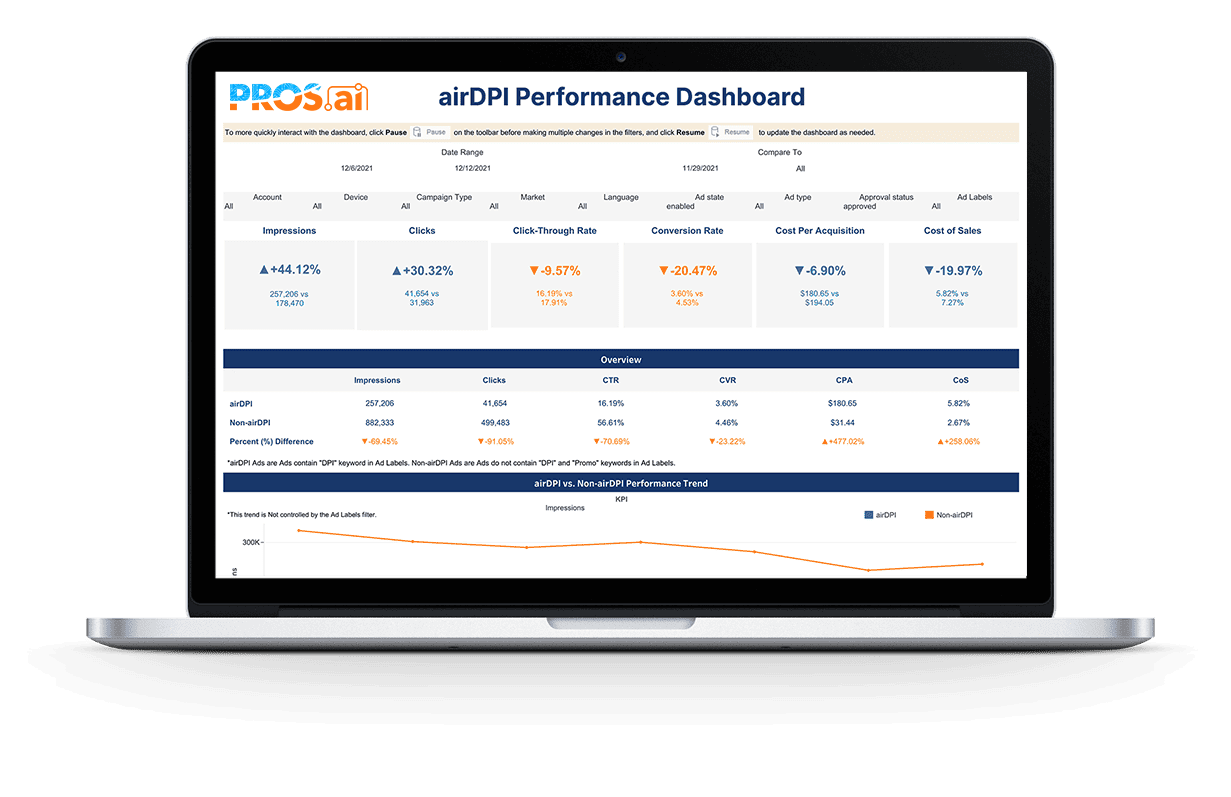
Compare ad performance with and without Dynamic Price Insertion (DPI)
This dashboard allows you to filter by account, device, campaign type, market, language, and various ad attributes. Users are able to identify where the airDPI technology works best and where DPI ads can be further pushed or optimized.
Filtering by account, device, campaign type, market, language, and various ad attributes, allows users to determine the impact of promotions and gather actionable insights on which ones are the most effective in driving conversions and revenue.