
Analyzing real-time User Search Data collected from customers’ internet booking engines (IBE) through Everymundo’s proprietary script, Everymundo dashboards provide data insights. These insights enable customers to pinpoint their most strategic routes and comprehend gaps between search volume and load factor for potential fare adjustments. Additionally, they can monitor user engagement on airTRFX Pages at different levels. Data Analytics prioritizes rolling out numerous dashboards with high data accuracy as standard reports accessible to all customers. Learn about the best practices to roll out Tableau Dashboards across customers:
Data Cleaning
On average, we collect over 9 million rows of raw user searches and over 200 thousand rows of raw booking data daily from customers’ IBE. To ensure the storage of correct, non-corrupted, and consistent data, we will conduct data Quality Assurance according to emDataStandards during customers’ migration to production on the final domain. If any issues are detected, we will raise tickets to developers for resolution.
Data Blending
We typically construct complex yet insightful dashboards by blending data, which involves combining multiple data sources for additional information. Also, when creating a visualization that serves all customers, it becomes even more crucial to predefine the best method for merging multiple datasets. The definition of relationships among tables impacts the details and key insights presented in each individual dashboard, the loading and calculation speed of the entire workbook, and the overall workloads imposed on the server.
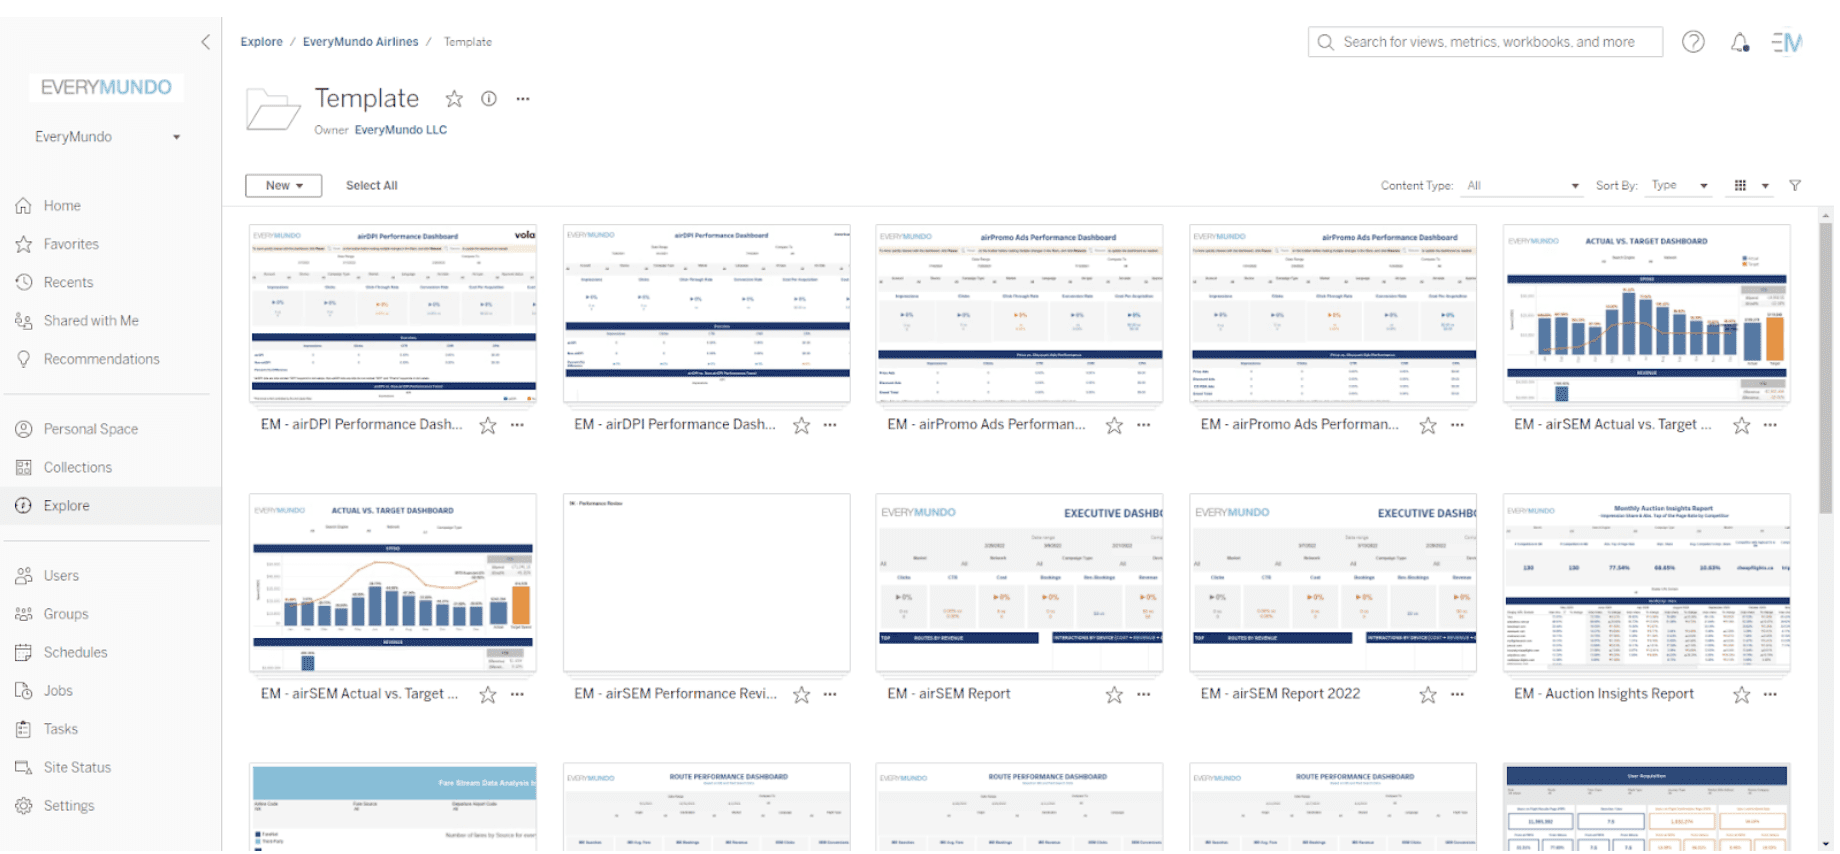
Template Workbooks
To achieve high efficiency in rolling out the standardized Tableau dashboards, Everymundo created and published template workbooks in a shared internal Tableau folder. The template workbooks showcase demo dashboards with pre-defined forms, structures, constructed charts, and tables. In addition, these dashboards also incorporate insightful key metrics, calculations, and clean designs following EveryMundo Brand Guidelines. The use of template workbooks reduces dashboard production time and maintenance costs by ensuring consistency and uniformity.
Replication Process
With the template workbooks in hand, the replication process becomes simple. Please see the general steps below:
- Download the template from the EM Template folder through Tableau Online
- Open the template workbook with the Tableau Desktop → Click on the “Data” tab. → Connect to the data source. → Replace the data source for a specific customer.
- Extracted data source with customized SQL query. Follow the instructions to re-edit the query for the customer.
- Extracted data that needs to be published to Tableau Server (several dashboards shared the same live data source). Check whether the necessary data source has already been published on Tableau Server.
- If yes, connect to the data source directly
- If not yet, create the local copy → Re-edit the query for the customer. → Publish to Tableau Server. → Connect to the live data source on Tableau Server and replace it with the previous one.
- Connect to other data sources such as Google Analytics, Google Ads, or Google sheet.

- Go through all of the views inside the workbook. Debug the issue caused by data source replacement, and replace the customized signal like currency code and date format.
- Review all the views and filters and make sure the dashboard is functioning properly.
- Publish the data source (if needed) and workbook.
- Schedule the extract time to refresh data and update the dashboard automatically.
QA
Data QA is the most important and final step of the dashboard replication process. During the QA process, our QA Engineer helps the team perform the below verifications:
- Verify the KPI metrics shown on the dashboards to ensure the numbers make sense.
- Verify the dashboards are rendering correctly in both tableau online and airTRFX Control. This is the backend platform that supports customers’ self-services in TRFX and displays data insights.
- Verify the dashboards are displayed as expected on the customer’s portal.
Depending on the dashboards, QA Engineers would also offer suggestions in dashboard design or dashboard annotation, which help us improve the user experience of our team products. If any issues are detected or any modification is needed, Jira tickets for dashboard creation are rejected by a QA Engineer. Data analysts perform further investigations to identify the root cause of the problems or perform any dashboard improvements.
The Data Analytics team at Everymundo works actively creating new dashboards for various relevant insights and maintaining the current dashboards for up-to-date features. Those interested in Everymundo dashboards can explore the demos published on EM Tableau Public profile. Data is modified to maintain anonymity. To access dashboards, please email [email protected].
Learn more about EveryMundo and our products: https://www.everymundo.com/products/![]()